REST API stress testing
I made a simple FastAPI project to test REST APIs using Locust library. I used local SQLAlchemy Database crud APIs as an example. Performance metrics are stored long-term via Prometheus time-series database and monitored via Grafana. The whole thing was very easy to write and set up in a few hours (with big thanks to Docker compose too for this, and Educative.io for insights), and the setup is ready for production too.
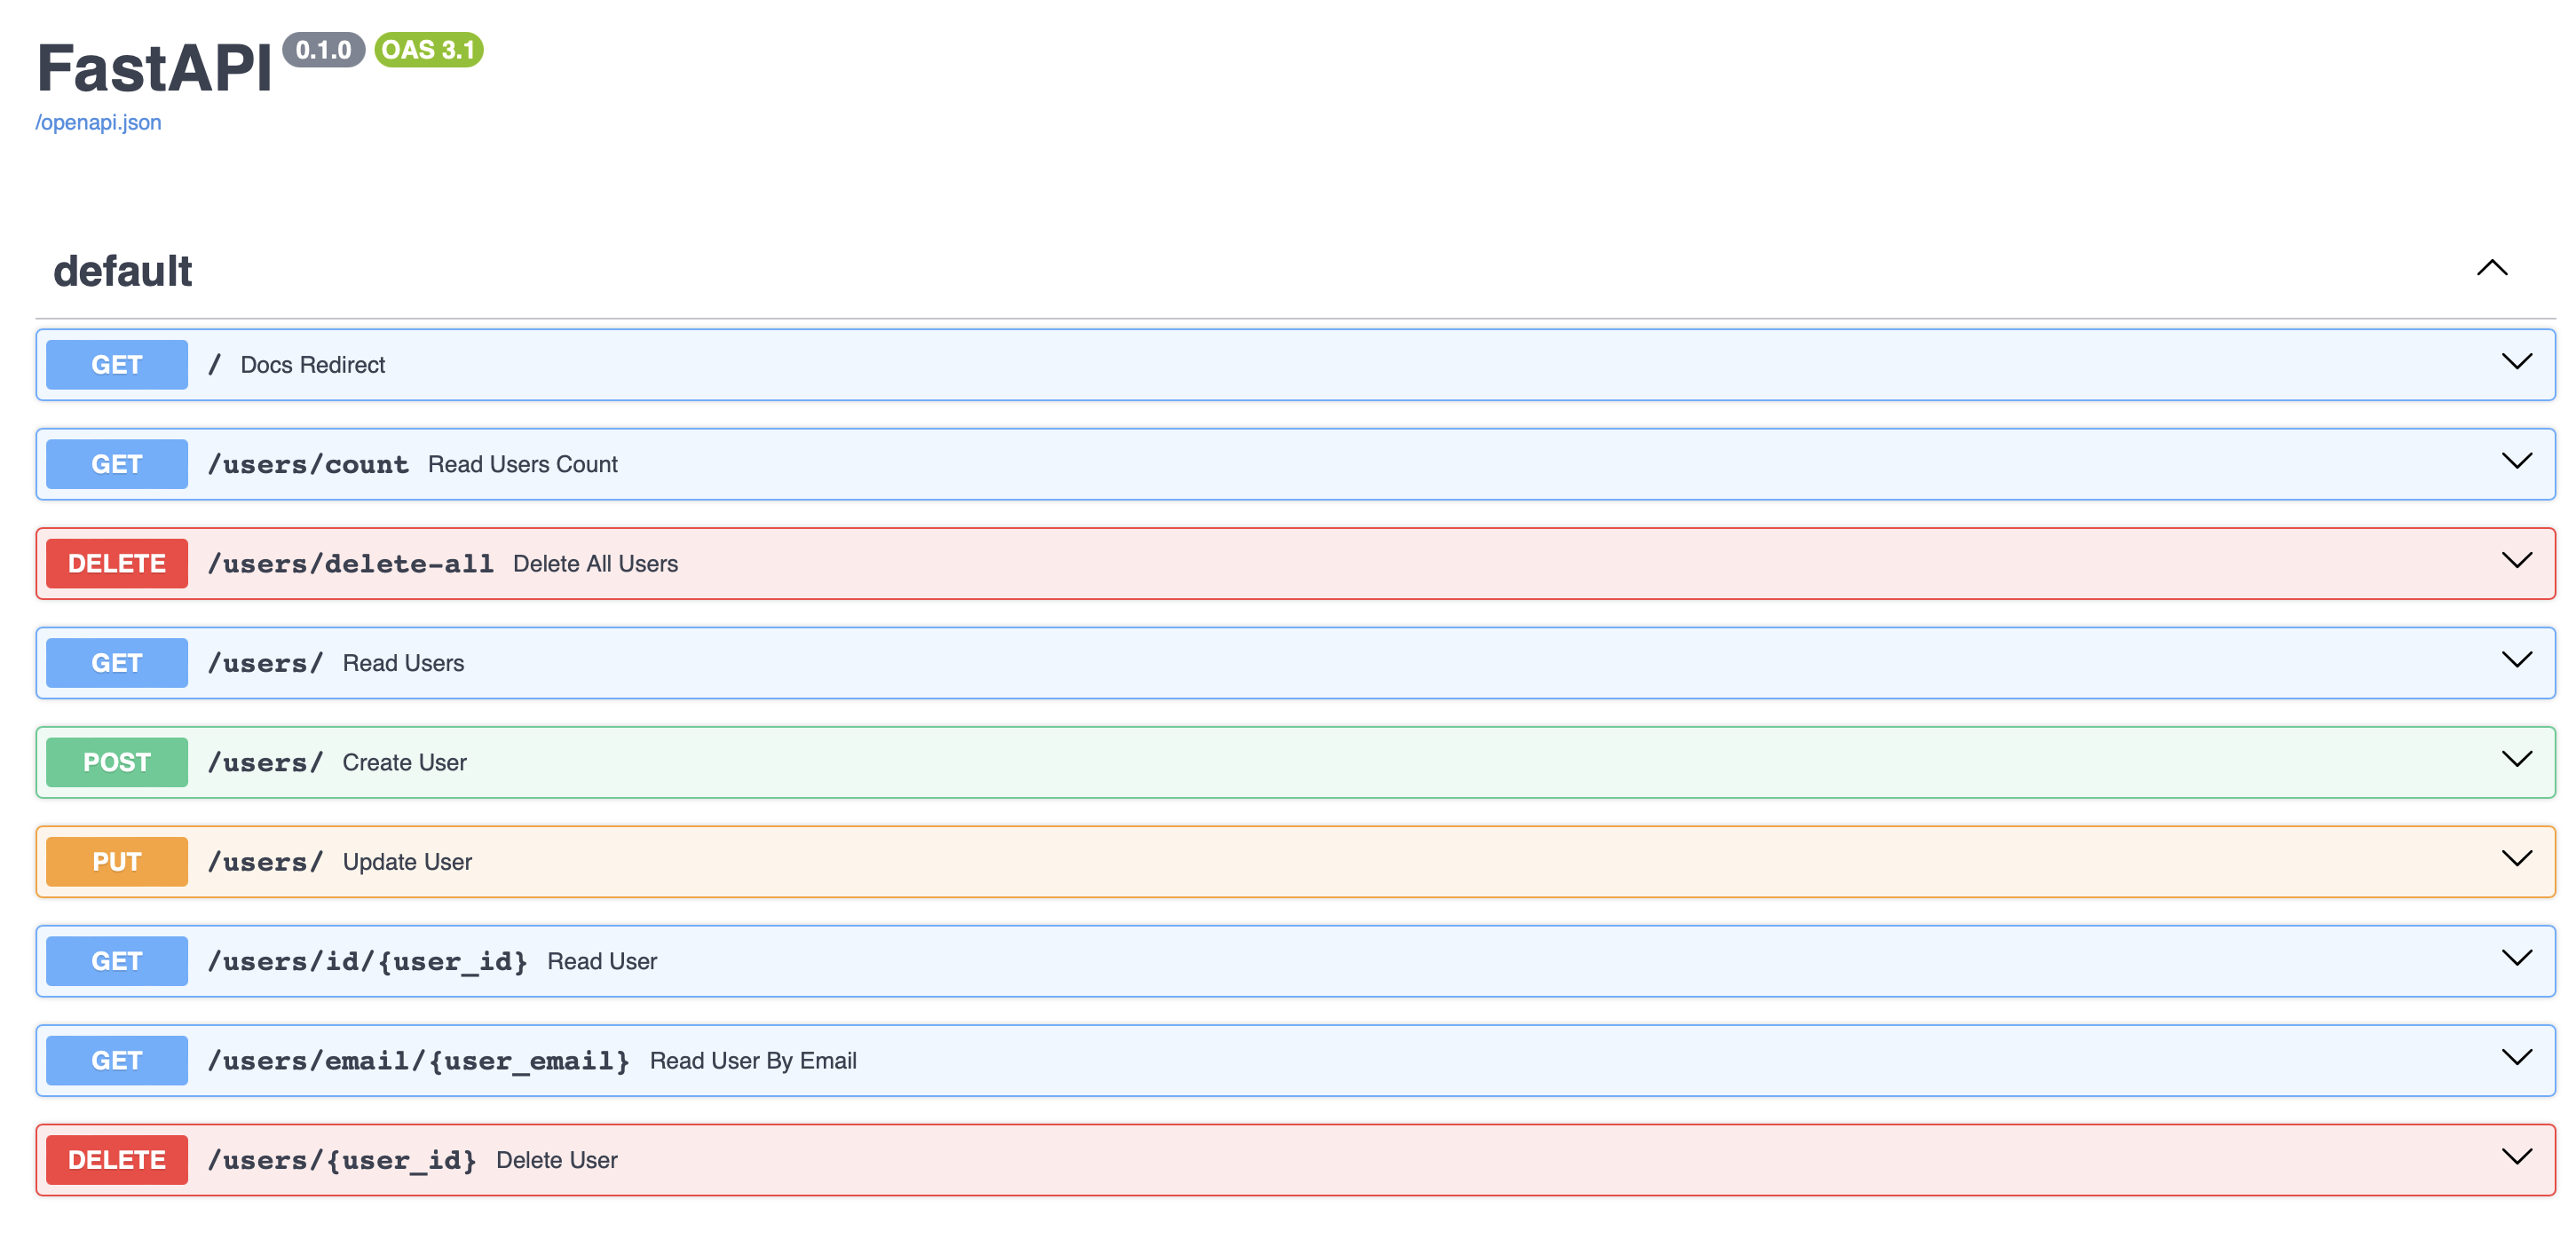
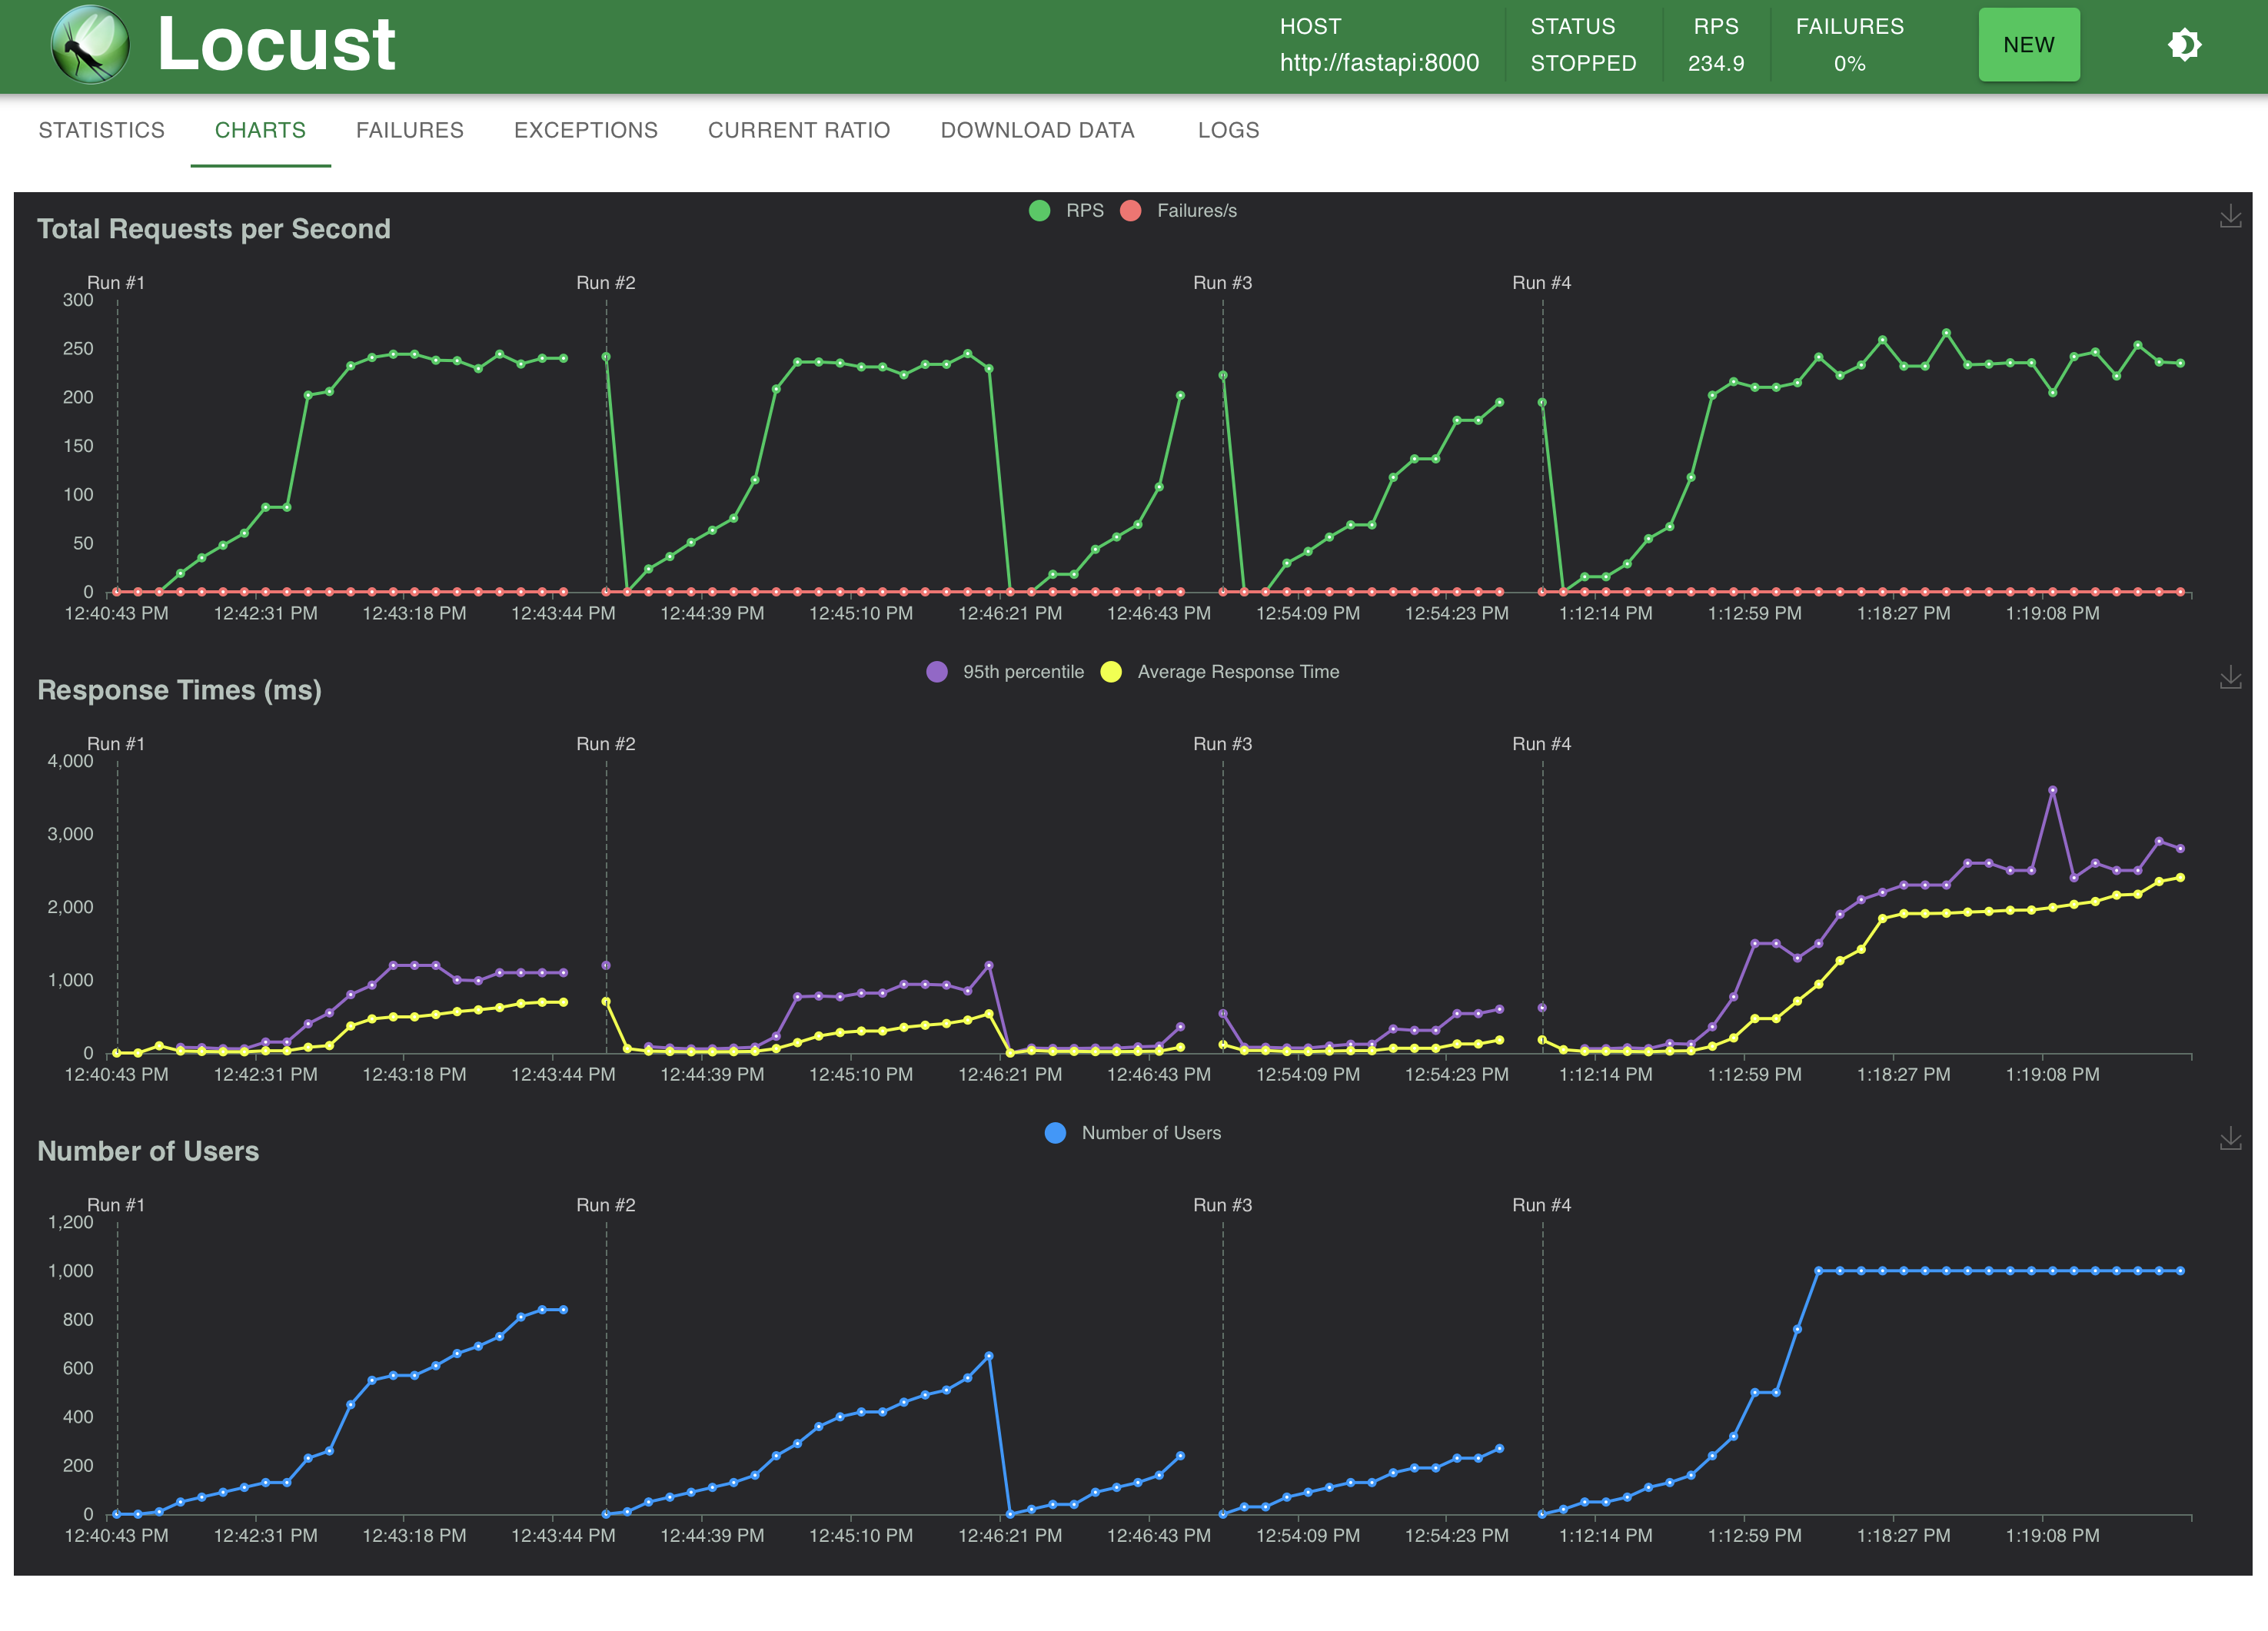
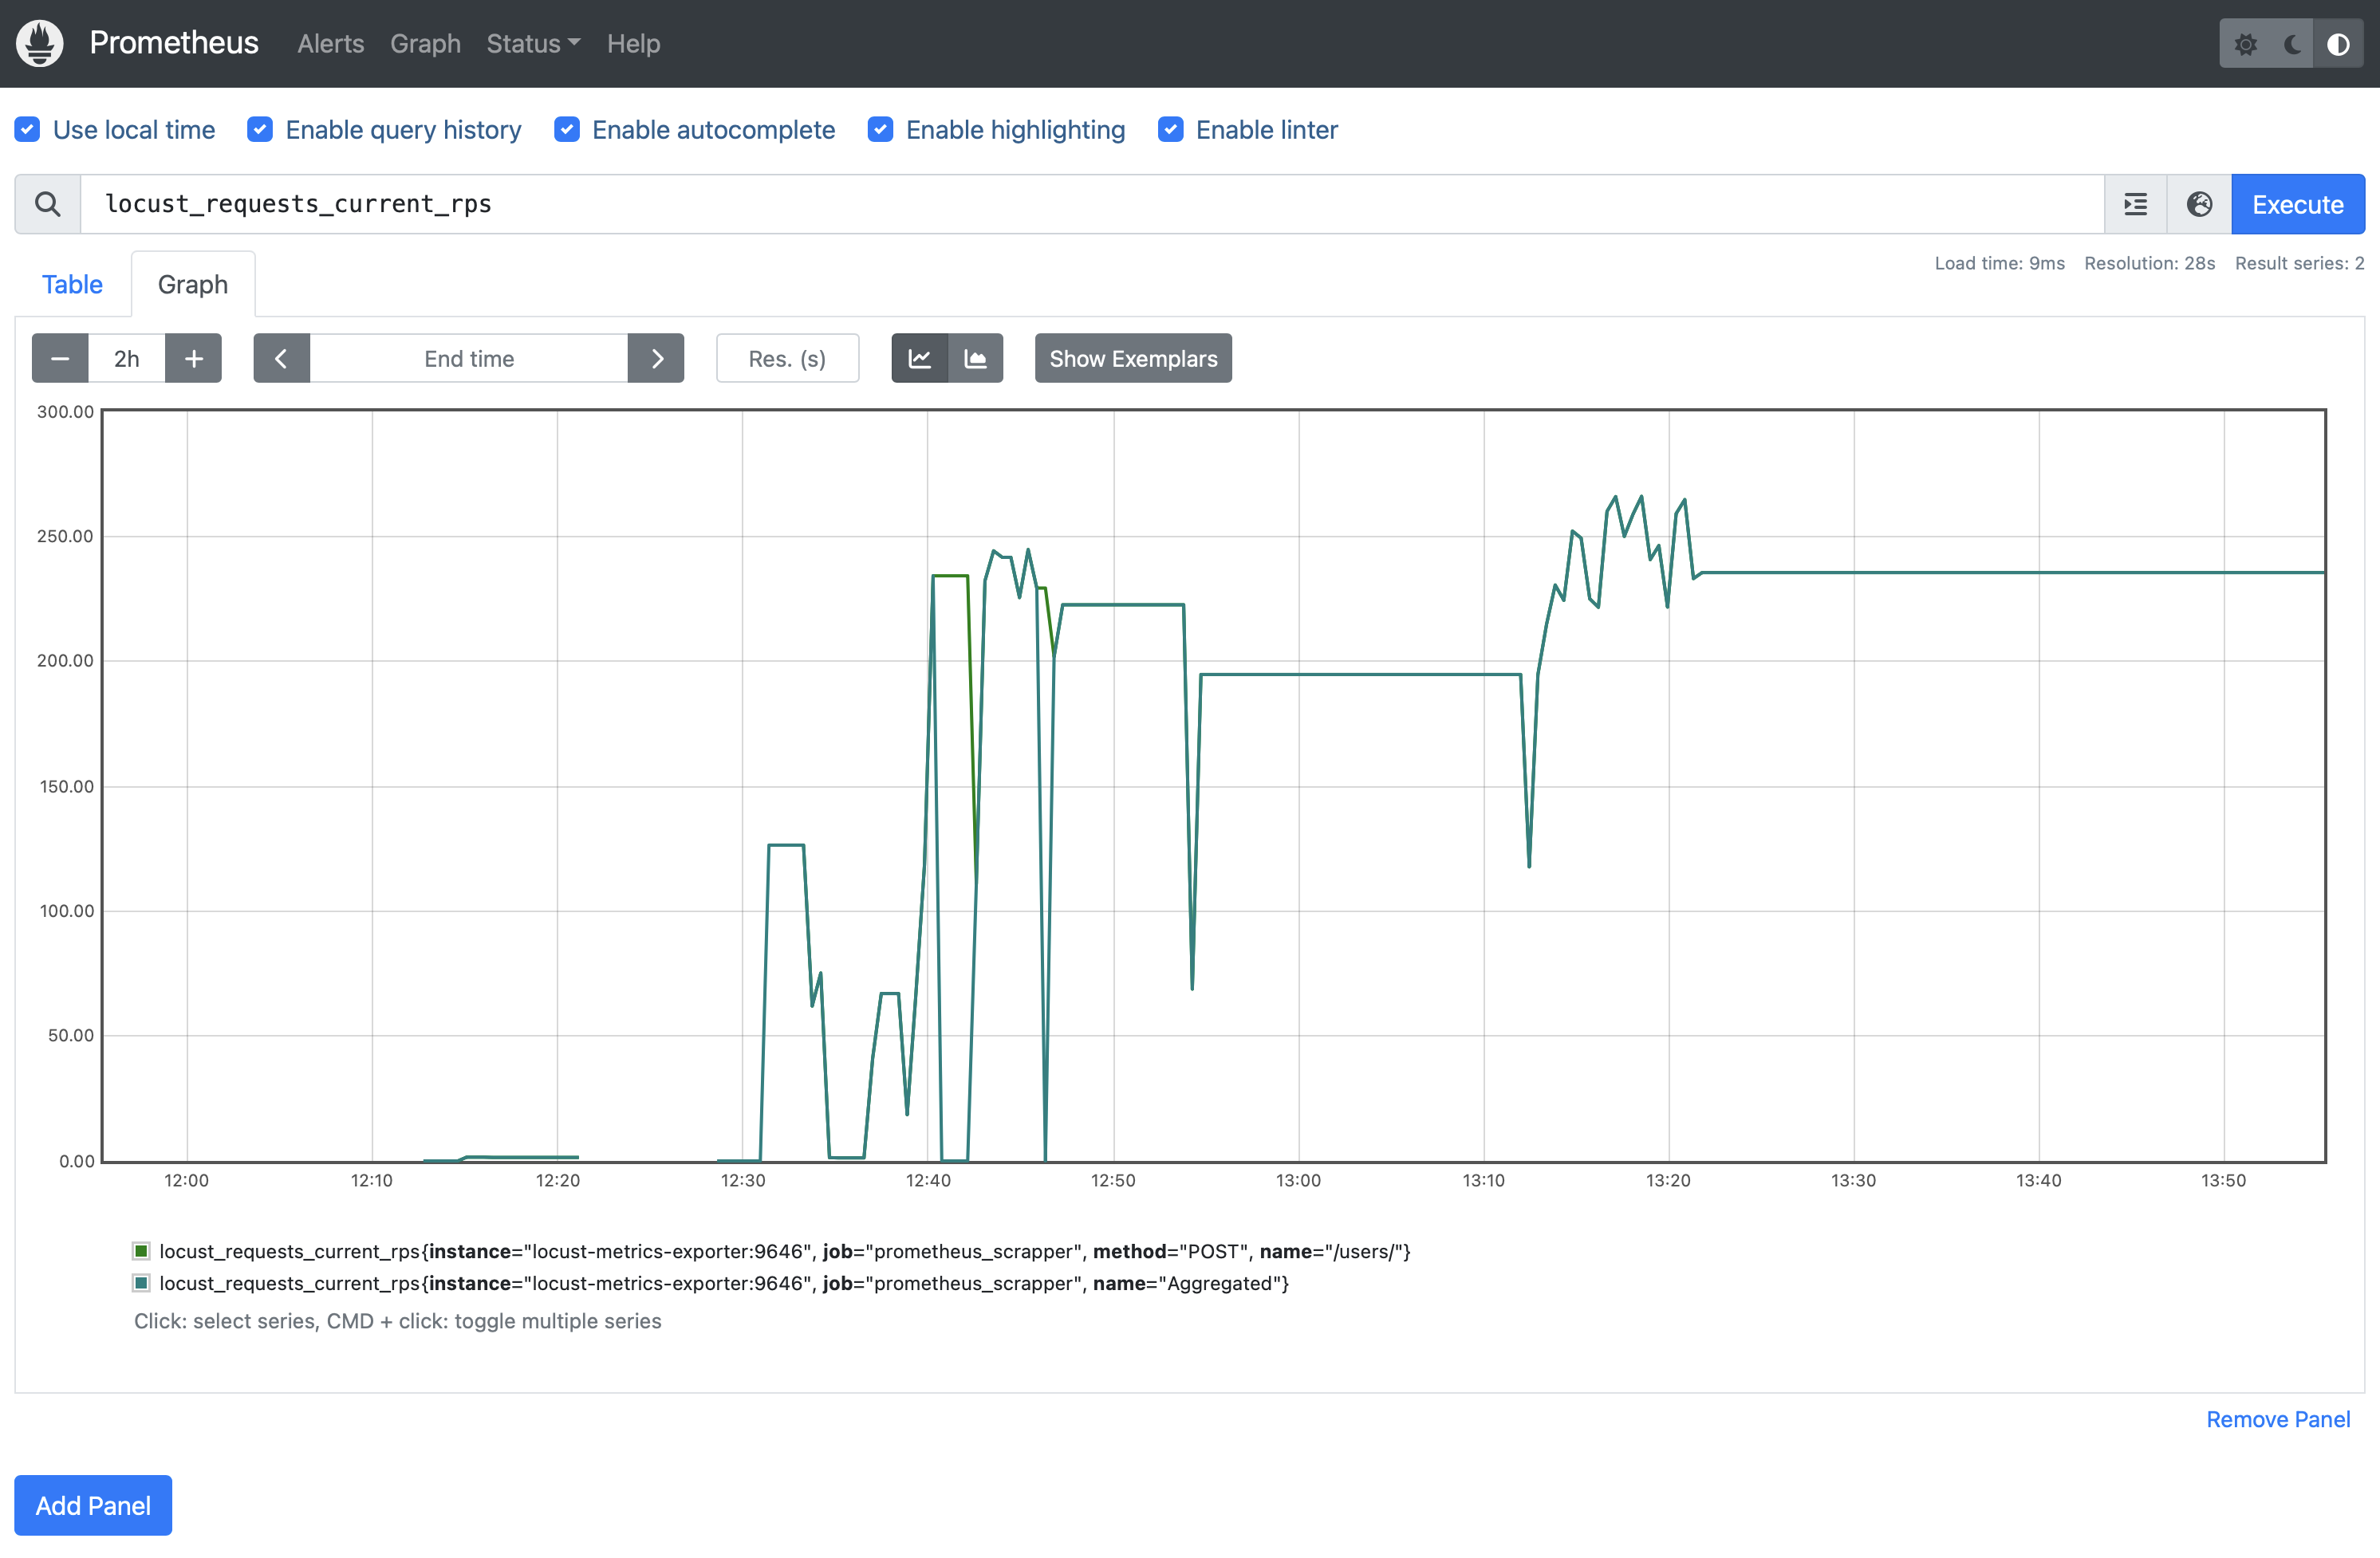
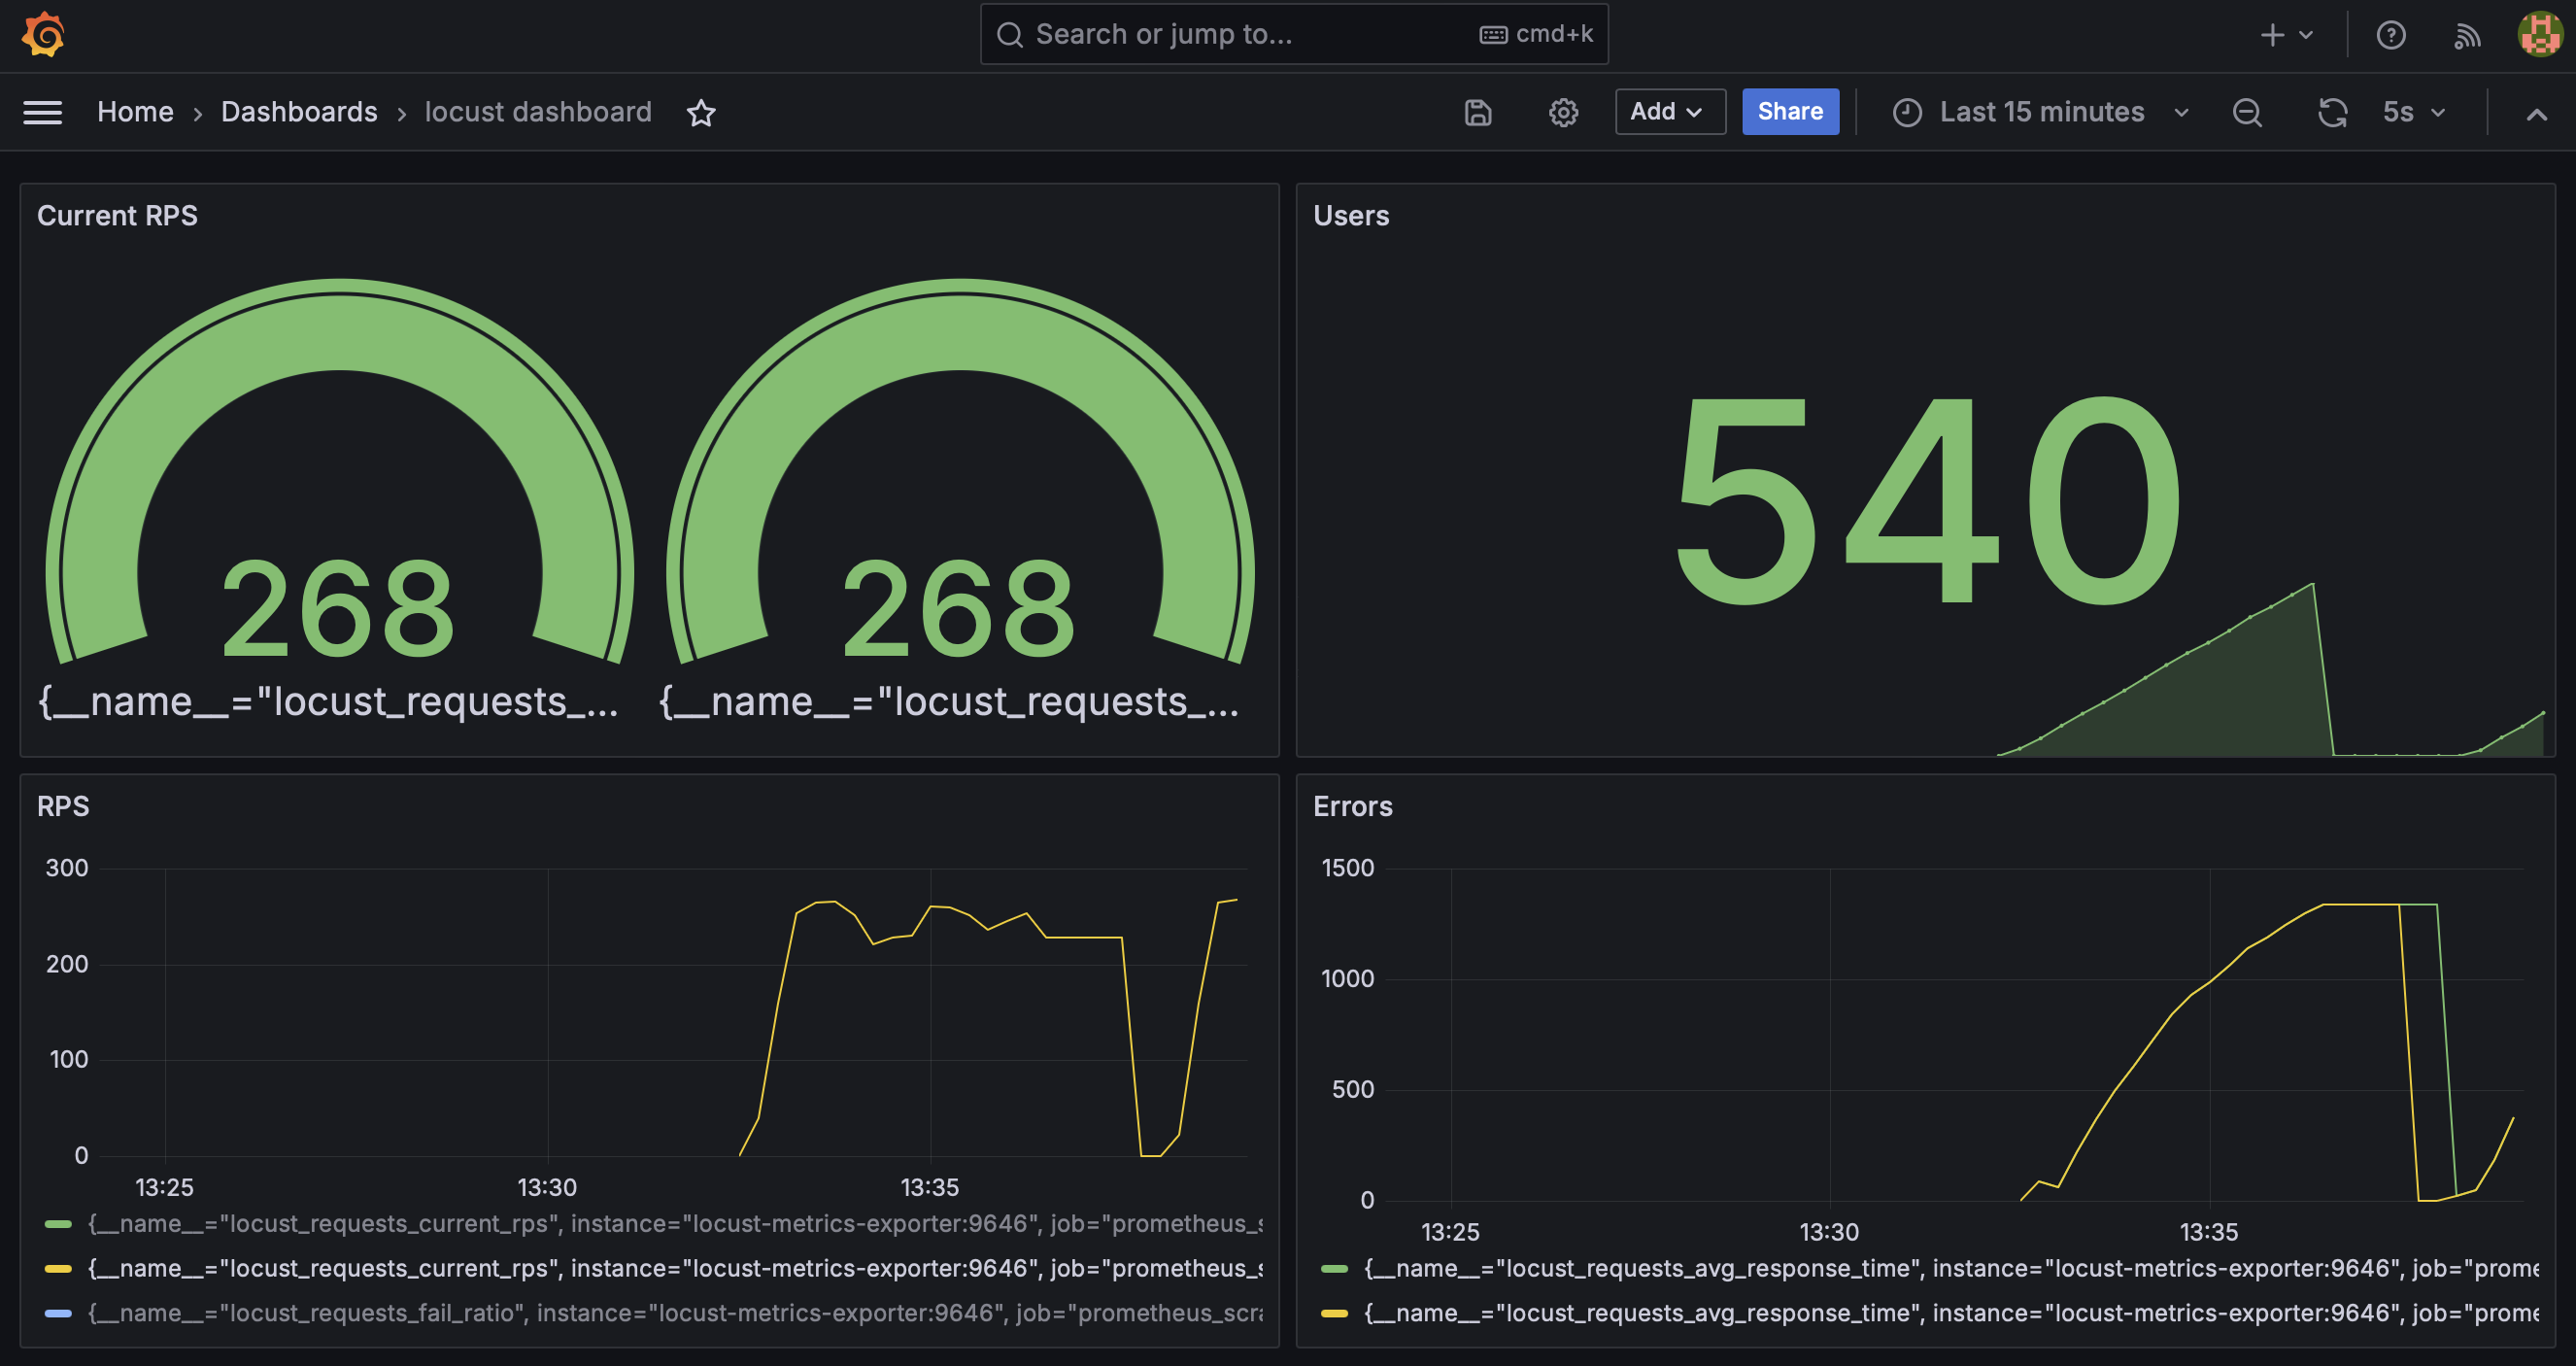
Screenshots of four WebApp services: FastAPI, Locust, Prometheus, and Grafana:
 |
 |
|---|---|
 |
 |
Description
Let me first describe the tools I used:
- FastAPI is a modern, fast (high-performance), web framework for building APIs based on standard Python type hints. It’s built on top of standard Python libraries and tools, including Starlette for the web parts and Pydantic for the data parts.
- Locust is a performance/load testing tool for HTTP and other protocols. Great UI, all tests in Python.
- Prometheus is a monitoring system with a focus on reliability, designed for capturing time-series data like metrics. It supports queries, visualization, precise alerting, service discovery, and external storage integrations.
- Grafana is an analytics and interactive visualization web application that provides charts, graphs, and alerts for the web when connected to supported data sources, like Prometheus. It’s widely used for monitoring metrics and data visualization across various environments, including cloud infrastructure and applications.
- Locust metrics exporter does exactly that: it preps locust metrics to be ingested by Prometheus.
Run the FastAPI app
Prerequisites for those with no Docker installed:
pip install -r requirements.txtStart ASGI server:
fastapi runOnce your server is running, you can access the Swagger UI by navigating to:
localhost:8000 # eq. http://127.0.0.1:8000in your web browser.
Run load testing using Locust
locust --host http://localhost:8000Use flag --processes X to define how many CPUs to run on, or -1 for all.
Then check:
http://localhost:8089
Long-term tracking with Prometheus and Grafana*
While Locust has it’s own tracking, all data is lost once the locust server stops (data can be manually exported). In order to preserve any metrics long-term we: - add Locust-metics-exporter - add Prometheus as a time-series DB - add Grafana for visualization - scale using docker-compose
Docker-compose makes running several services straightforward (no Dockerfile needed):
docker-compose upNotable points in compose.yml: - mount volumes instead of copying as any changes to local files will be reflected in the container immediately:
 volumes:
- .:/app- each container is accessible to other containers within the same Docker Compose network using the service names as hostnames, for example:
LOCUST_HOST=http://fastapi:8000, where fastapi is the name of the service that runs FastAPI. - to control how many CPUs you want to use for locust testing use
--processes X(X=-1 means use all). rostands for read-only- use
volumeto persist all the data even if the container is stopped, see all volumes withdocker volume ls
Prometheus and Grafana will then store data as long as it’s needed, their UIs are excellent to set up all sorts of alerts and tracking.
http://localhost:9090
http://localhost:3000
*Inspired by Yusuf Tayman’s blog.
Conclusion
I wrote and ran simple FastAPI app with database (SQLAlchemy), stress test APIs (Locust) and monitor performance (Prometheus/Grafana), all containerized using docker-compose. While all WebApps ran on a local machine, scaling by splitting into microservices, or moving to the cloud host, would be straightforward (hosting can be done on EC2s with relevant ports exposed).