import matplotlib.pyplot as plt
import numpy as npMatplotlib
np.random.randn()-2.5106811179598463x = np.random.rand(10,1)
y = np.random.rand(10,1)
plt.plot(x,y,'.')
plt.show()
def plot_means_and_stdevs(x1, y1, x2, y2):
    fig, axs = plt.subplots(1,3, figsize=(10,3))
    for i in range(3):
        axs[i].plot(x1[:,i], y1[:,i], '.')
        axs[i].plot(x2[:,i], y2[:,i], '.')
        axs[i].set_xlabel('means')
        axs[i].set_ylabel('stdev')
        axs[i].set_title(f'Channel #{i+1}')
        axs[i].legend(['eval', 'train'])
    plt.show()
x1 = np.random.rand(10,3)
y1 = np.random.rand(10,3)
x2 = np.random.rand(10,3)
y2 = np.random.rand(10,3)
plot_means_and_stdevs(x1, y1, x2, y2)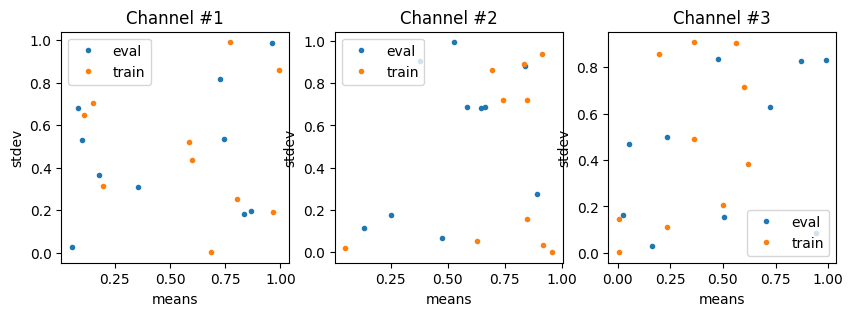
A somewhat quicker method without using axes and figsize is to use plt.subplot (note that index is 1-based):
for i in range(3):
    plt.subplot(1,3,i+1)
    plt.plot(x1[:,i], y1[:,i], '.')
    plt.plot(x2[:,i], y2[:,i], '.')
    plt.xlabel('means')
    plt.ylabel('stdev')
    plt.title(f'Channel #{i+1}')
    plt.legend(['eval', 'train'])
plt.show()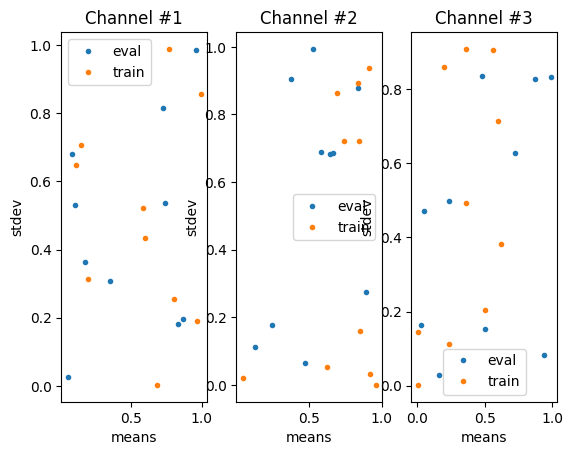
To remove axes use:
plt.axis('off')
To save image:
plt.savefig("test.png", bbox_inches='tight')<Figure size 640x480 with 0 Axes>