from pathlib import PosixPath
import ipyplot
import cv2
from PIL import Image
is_jupyter = get_ipython().__class__.__name__ == 'ZMQInteractiveShell'Visualizations
Images
# !pip install opencv-pythonim = 'assets/image_20211012_row53_col1.png'
mask = 'assets/mask_20211012_row53_col1.png'The easiest way to visualize images is through PIL:
im_pil = Image.open(im)
im_pil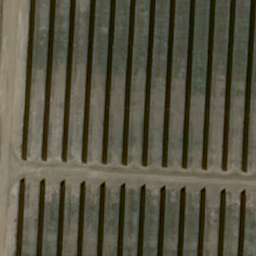
If one needs to use OpenCV:
def load_image(im):
    if isinstance(im, (str, PosixPath)):  # if str or Path load image
        im = cv2.imread(str(im))
    elif isinstance(im, Image.Image):  # convert PIL.Image.Image to numpy.array
        im = np.array(im)
    return im


def show_image(im, title=None):
    """
    Load and show (or not) image using cv2.

    Args:
        im (str or Path or numpy.array or PIL.Image.Image)

    Returns:
        key pressed (str)

    """
    im = load_image(im)
    if not is_jupyter:
        print('Image is shown on desktop.')
        cv2.imshow(title if title else 'pic-display', im)
        print('Press any button to continue (if needed click on an image window too; Q to break).')
        key_pressed = chr(cv2.waitKey(0))  # 0 to wait for user input, >0 for milliseconds to wait
        return key_pressed
    else:
        display(Image.fromarray(im))
show_image(im, 'image')
Matplotlib.pyplot.axis.plot
See here.
Plot multiple images
We can use ipyplot (pip install ipyplot), but it has annoying issue. Instead I made a custom one:
from utils.plot import plot_pil_imagesplot_pil_images([im_pil, im_pil, im_pil.transpose(Image.ROTATE_90)],
['orig', 'no change', 'transpose 90'])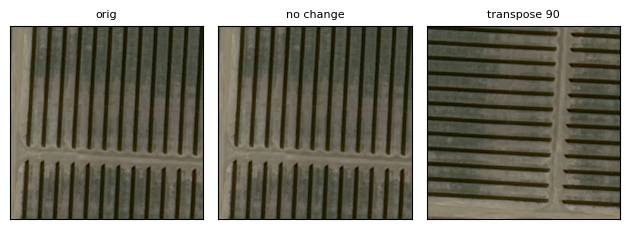
Graphs
The following is a pseudo-code for demonstration.
To specify the legend location:
plt.legend(leg, bbox_to_anchor=(1.04,1))some legend arguments:
leg = plt.legend(loc='best', ncol=2, mode="expand", shadow=True, fancybox=True)
leg.get_frame().set_alpha(0.5)
if no legend is specified then the label will be used:
plt.plot(t1, t1**n, label=f"n={n}")